Bias Correction Applications


CEVE 543 - Fall 2025

2025-10-22

Today’s Paper

Ines and Hansen (2006):

Ines, Amor V. M., and James W. Hansen. 2006. “Bias Correction of Daily GCM Rainfall for Crop Simulation Studies.” Agricultural and Forest Meteorology 138 (1): 44–53. https://doi.org/10.1016/j.agrformet.2006.03.009.

Part 1: Basic Warmup — The Setup

  • Part 1: Basic Warmup — The Setup

  • Part 2: Understanding the Results — Correcting the Rain

  • Part 3: Deeper Questions — Yields & Implications

Q1: What is the “drizzle bias” (the typical distortion) observed in daily GCM rainfall when compared to station-level observations?

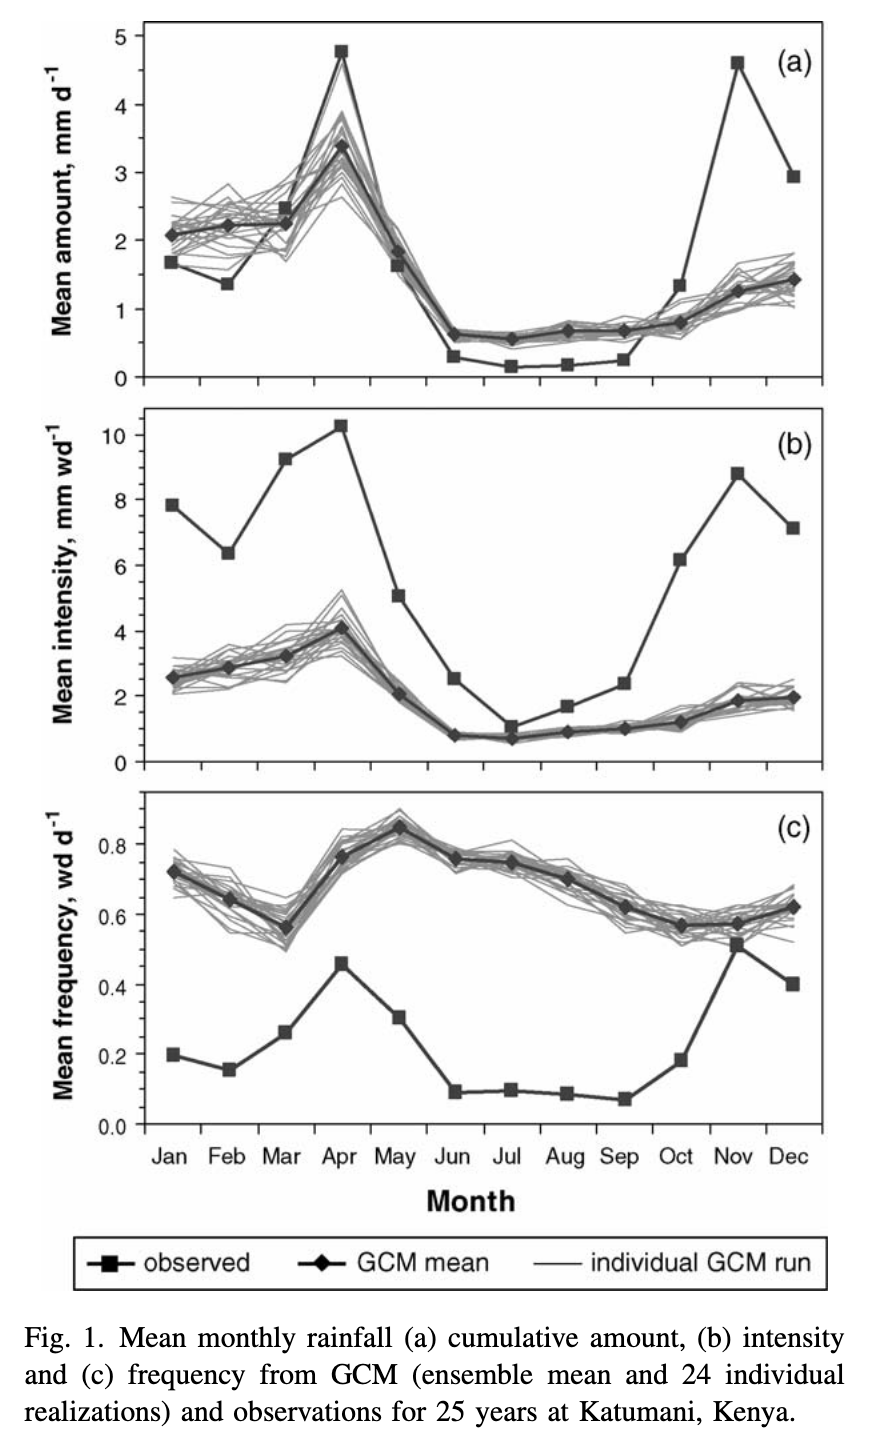
Q2: Looking at Fig. 1(b) and 1(c), how does the “GCM mean” (diamonds) visually compare to the “observed” (squares) for mean intensity and mean frequency?

Q3: What crop simulation model was used, and what was the “observed truth” used to evaluate the yield simulations?

Q4: The authors propose a two-step bias correction. What two statistical properties of daily rainfall does this procedure adjust?

Q5: What statistical property does the simpler “Multiplicative Shift” (MS) procedure correct, and what properties does it ignore?

Q6: Why is correcting daily rainfall frequency and intensity critical for a non-linear impact model (like a crop model)?

Q7: What was the strategic purpose of “neutralizing” the effect of temperature and solar radiation by using their long-term monthly means?

Q8: What is the purpose of running simulations with an ensemble (multiple GCM realizations) and then averaging the resulting yields?

Part 2: Understanding the Results — Correcting the Rain

  • Part 1: Basic Warmup — The Setup

  • Part 2: Understanding the Results — Correcting the Rain

  • Part 3: Deeper Questions — Yields & Implications

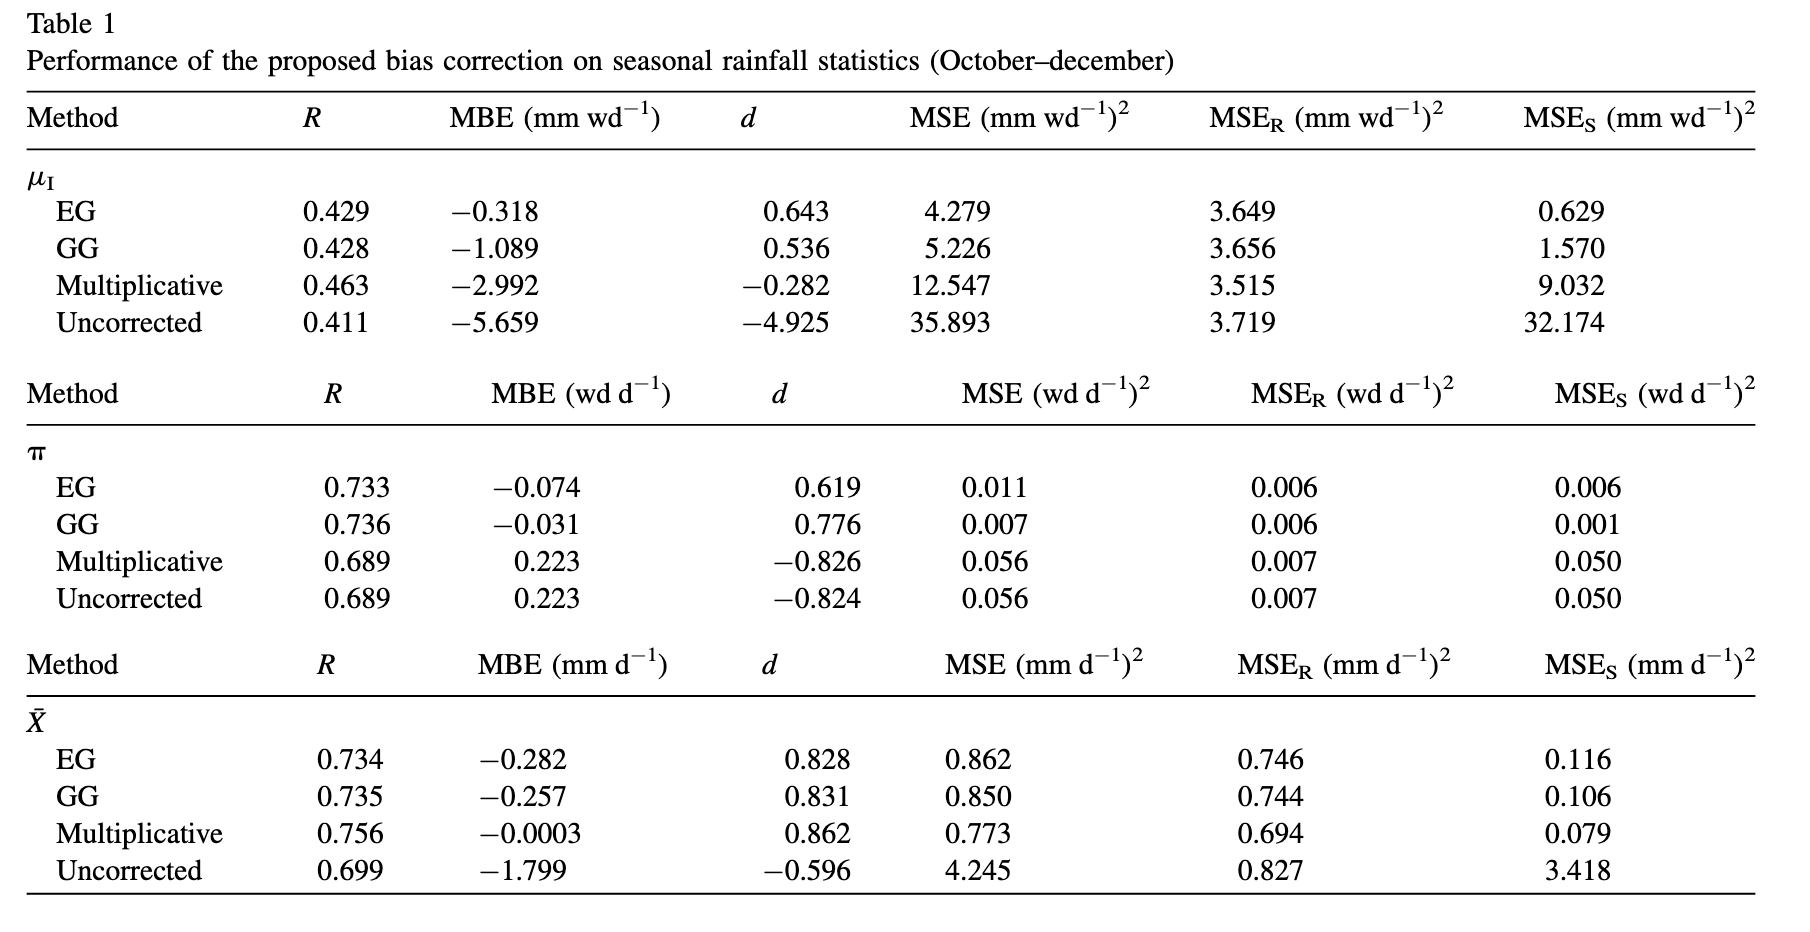
Q9: What does Table 1 (Mean Bias Error) show about the performance of the EG and GG methods?

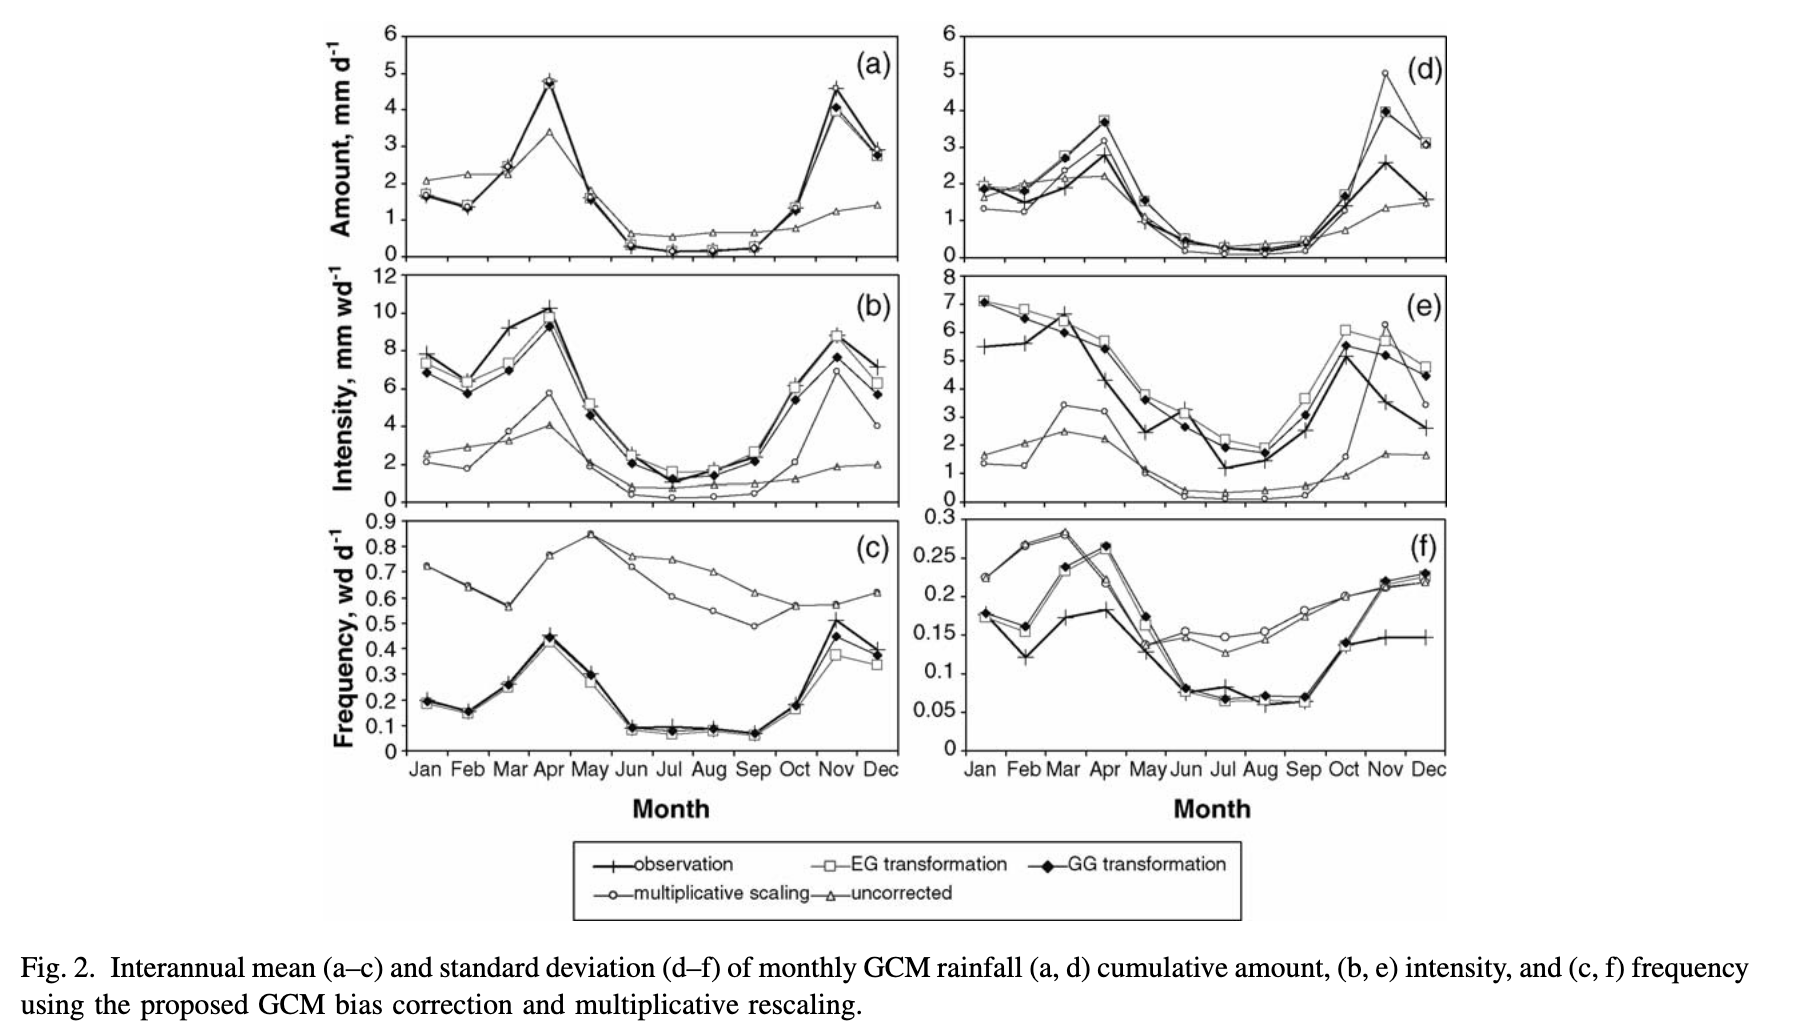
Q10: How does the probability density function (PDF) in Fig. 2 visually represent the drizzle bias?

Q11: In the Quantile-Quantile plot (Fig. 3), what does it mean that the GCM plot (triangles) is consistently below the 1:1 line?

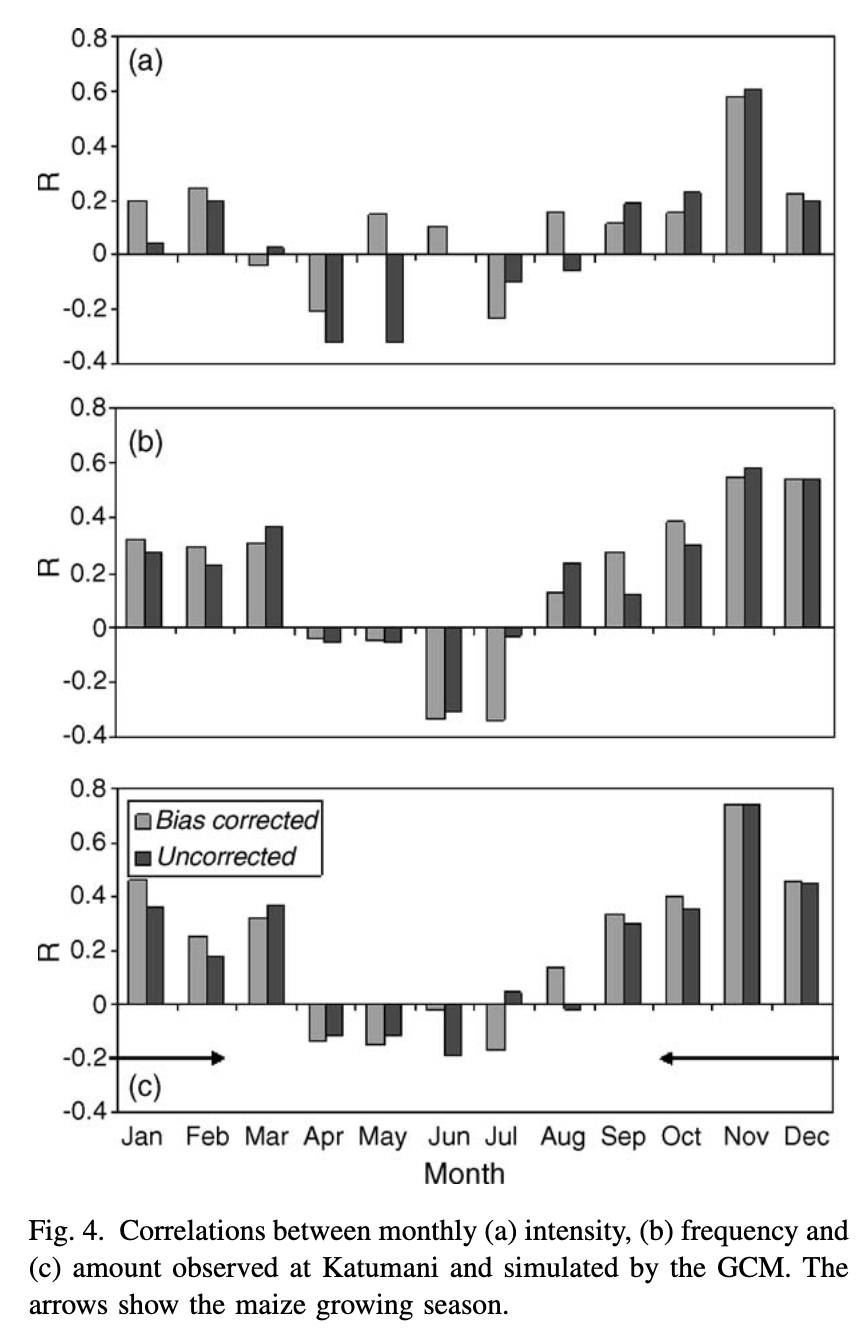
Q12: How does Fig. 4 demonstrate the GCM’s limited skill (correlation) in predicting the timing of monthly rainfall?

Q13: After fixing mean rainfall, frequency, and intensity, a significant yield bias remained. What uncorrected, higher-order GCM bias was the likely cause?

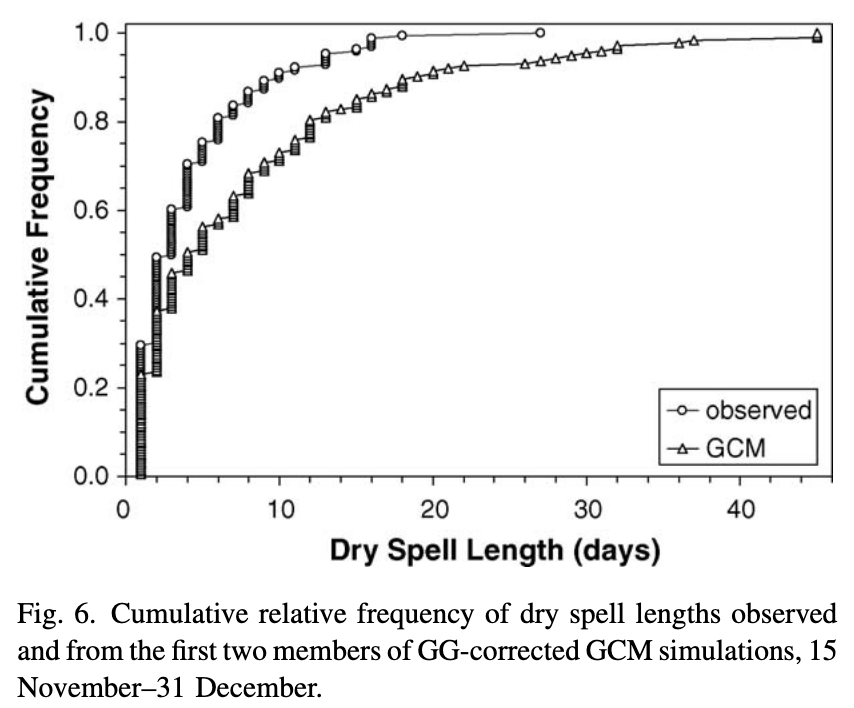
Q14: How does Fig. 6 visually demonstrate the GCM’s bias in dry spell lengths?

Part 3: Deeper Questions — Yields & Implications

  • Part 1: Basic Warmup — The Setup

  • Part 2: Understanding the Results — Correcting the Rain

  • Part 3: Deeper Questions — Yields & Implications

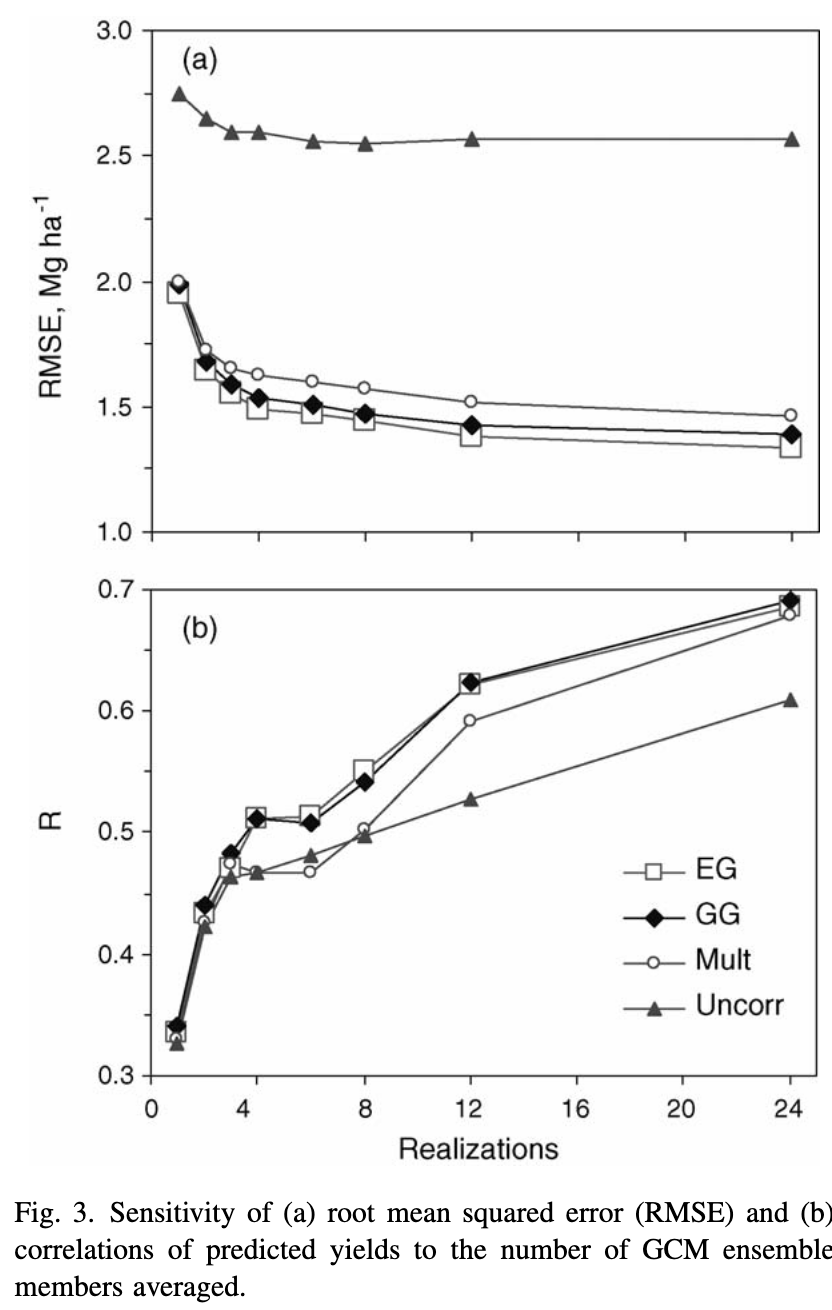
Q15: According to Table 2, how well did the uncorrected GCM rainfall (“Uncorr”) perform in simulating yields?

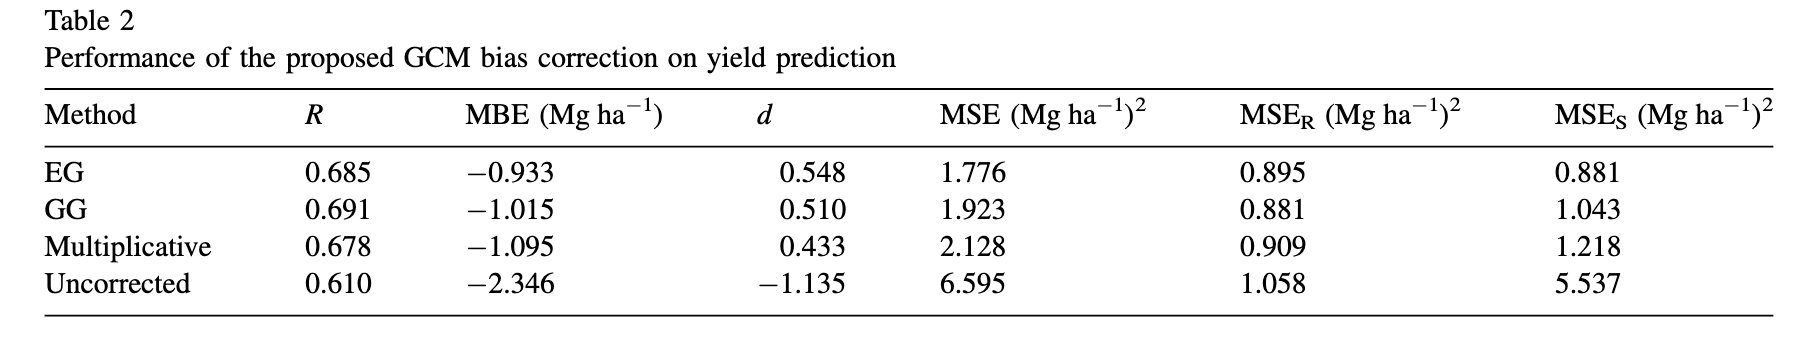
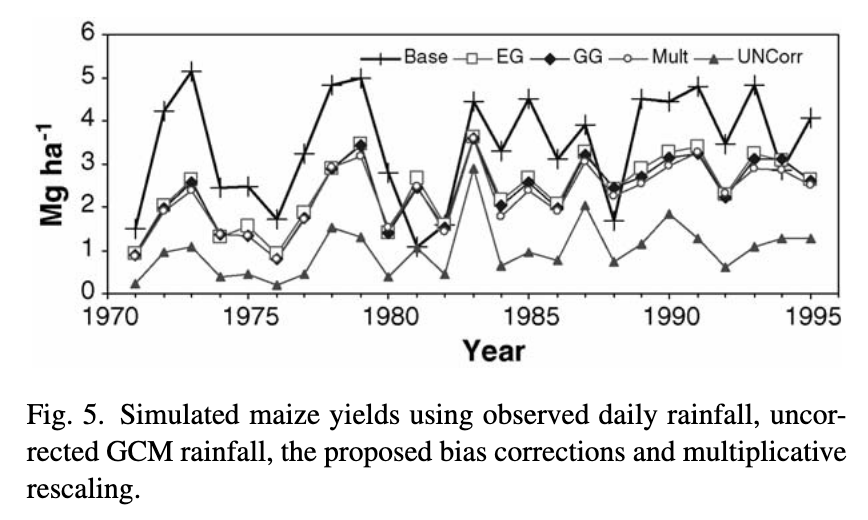
Q16: Looking at Fig. 5 and Table 2, how did the bias-corrected methods (EG, GG, Mult) change the simulated yield time series?

Q17: Why was it “surprising” that the “Simple” Multiplicative Shift (MS) method performed nearly as well as the complex two-step method in improving yield skill (correlation)?

Q18: What is the ultimate limitation of using this (or any) bias-corrected GCM for practical seasonal forecasting?

Q19: For a flood study (sensitive to extremes), why might the EG (Empirical-Gamma) method be a more robust choice than the GG (Gamma-Gamma) method?